Quantifying probabilities from ballistic models
09 Oct 2017gbf codes Here is presented an extended version of the Matlab post-processing function developed for the Great Balls of Fire model for the probabilistic hazard assessment of ballistic impact.
Table of content
- tags: gbf
- 1. From ballistic modelling to probabilistic hazard assessment
- 2 Using the function
- 3 Outputs and results
- 4 Displaying results
Requirements
The initial function provided with the Great Balls of Fire model has been modified so output files of virtually any model can be loaded and processed through methods described here. Requirements are:
- Impact coordinates must be defined in UTM WGS84
- Files must be ascii and tab delimited
- Columns in the output file should be organised as indicated in the table below. Note that adding extra columns is acceptable
| Column | Data | Unit |
|---|---|---|
| 1 | Easting | m |
| 2 | Northing | m |
| 3 | Altitude | m asl |
| 4 | Mass | kg |
| 5 | Diameter | m |
| 6 | Kinetic energy | kJ |
Source material
Source material includes:
- Our JVGR paper
- The GBF user manual
- This 2017 IAVCEI presentation
Dependencies
The post-processing functions rely on two files published on the Matlab File Exchange:
- utm2ll by François Beauducel
- plot_google_map by Zohar Bar-Yehuda
Access the code
The post-processing function can be obtained here
1. From ballistic modelling to probabilistic hazard assessment
1.1 The need of a reference area
Unlike for tephra deposits, the discrete nature of ballistic impacts requires to average single ballistic impacts on a grid. Grids can fall in two main categories that are polar and cartesian. However, averaging impacts on a grid creates a dependancy of the final result to the spatial resolution. In other words:
- Is it acceptable for a grid to have pixels areas that vary with distance from the vent (e.g., polar grids)?
- Since increasing the pixel area increases the probability of impact, is there a threshold of grid resolution that provides stable results?
- How does the grid shape/resolution interacts with the number of simulated ballistics and affect the stability of results?
Probabilistic hazard assessment for ballistic impacts should therefore address these issues, one possible way to do so being through sensitivity analysis. This new post-processing function can be accessed either through a GUI or programatically, which facilitates sensitivity analyses. Refer to our JVGR paper for more information.
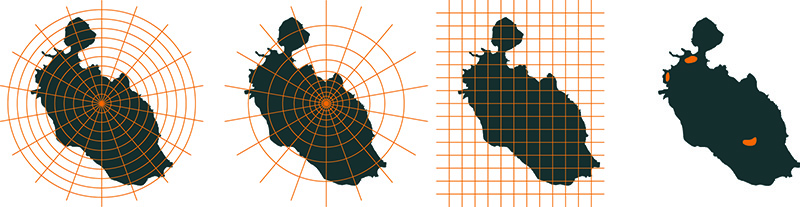
In this post-processing function, a true polar grid is not implemented. Instead, probabilities of impact are calculated using both a given distance from the vent (i.e., concentric rings) and at a given radial sector around the vent. The union probability of both approaches will result in a polar grid.
1.2 What probabilities?
In frequentist analyses, probabilities must represent a ratio between a number of ballistic impacts satisfying a given characteristics (e.g., a kinetic energy at impact that exceeds a threshold) and a total number of ballistics. Depending on our definition of the second term, let’s call it BTOT, probabilities are going to express a different message.
If BTOT is the total number of simulated ballistics, the probability expresses P(Z, ET), that is:
If BTOT is the total number of ballistics impacting a given zone, the probability expresses P(ET|Z), that is:
These probabilities are significantly different, and both are considered in the post-processing approach presented here. For simplicity, we will refer to BTOT as absolute probabilities and BTOT as relative probabilities.
2 Using the function
2.1 Input arguments
Table 2 summarises the input parameters required by the processGBF function. Functions can be called using a GUI, arguments or a structure. The following steps assume that you are in the root of the folder containing the functions.
| Variable | Description | Unit | Type |
|---|---|---|---|
| pth | Path to the output file | - | String |
| name | Run name | - | String |
| gridRes | Resolution of the cartesian grid, which can be enter either as a single value or a 1x2 vector. In the case of a 1x2 vector, the first value is the resolution of the grid used for the pixel approach and the second value is the resolution of the grid used to map the result of the concentric and radial approaches. If only one value is entered, the resolution of the grid for the concentric and radial approaches is arbitrarily set to be 10% finer than the grid used for the pixel approach. This is only done to ensure smooth display on maps. | m | Numeric |
| subset | Subset of the total population of VBPs. Default is 100%, but can be decreased for sensitivity analyses | % | Numeric |
| eT | Energy threshold(s) used to calculate exceedance probabilities. Multiple values can be defined as a vector | J | Numeric |
| pT | Probability threshold(s) used to calculate energies occurring at a given exeedance probability. Multiple values can be defined as a vector | % | Numeric |
| dI | Distance interval used to define concentring rings | m | Numeric |
| rI | Angle interval used to define radial sectors | Degrees | Numeric |
| vE | Vent easting | m | Numeric |
| vN | Vent northing | m | Numeric |
| vZ | Vent zone defined as a numeric value only (i.e., do not enter the letter) and *positive* in the N hemisphere and *negative* in the S hemisphere (numeric) | - | Numeric |
2.1.1 Using the GUI
In the Matlab command, type:
processGBFThis approach will open two consecutive GUIs that will prompt you to i) locate the input file and ii) define the additional variables described above.
2.1.2 Using arguments
This approach allows the user to enter all input argument separately from the command line:
processGBF(pth, name, gridRes, subset, eT, pT, dI, rI, vE, vN, vZ)All variables refer to Table 1.
2.1.3 Using an input structure
The structure approach combines the arguments 2-9 of the argument approach into a structure. It is useful to use to output of a GBF post-processing run.
processGBF(pth, run)where run is a Matlab structure named as the arguments 2-9 of the argument approach.
2.2 Output argument
Calling:
project = processGBF(...)returns a Matlab structure containing all the output data… but stick around until the next section!
3 Outputs and results
Upon completion of the processGBF function, a folder named after the name variable is created, which contains results in a Matlab format (i.e., name.mat) and in a ESRI ASCII grid format. All probabilities are expressed in % and all energies are expressed in Joules.
3.1 ASCII grid format
Three main categories of ASCII files are written:
- pixel, which use a cartesian grid
- concentric, which use concentric zones around the vent
- radial, which use radial sectors around the vent
Each of these categories have sub-categories defined by:
- prob, which contain the exceedence probabilities (%) for ballistic impacts to exceed a given threshold of kinetic energy
- en, which contain the typical kinetic energy (J) at impact for a given exceedance probabillity
The probability files are themselves differentiated between:
- abs, which contain absolute probabilities and
- rel, which contain relative probabilities
3.2 Matlab format
The Matlab output file, i.e. name.mat, contains the most comprehensive output. It is compiled as a Matlab structure containing:
- inBal, which is a duplicate of the input arguments shown in Table 1
- bal, which contains the data of all simulated particles
- pixel, which contains the result of the processing performed using a cartesian grid
- concentric, which contains the result of the processing performed using concentric zones around the vent
- radial, which contains the result of the processing performed using radial sectors around the vent
.bal
| Field | Description |
|---|---|
| x | Easting of each ballistic (n x 1 vector, where n is the total number of simulated ballistics) |
| y | Northing of each ballistic (n x 1 vector) |
| lat | Latitude of each ballistic (n x 1 vector) |
| lon | Longitude of each ballistic (n x 1 vector) |
| e | Kinetic energy (J) at impact of each ballistic (n x 1 vector) |
| n | Total number of simulated ballistics |
| d | Distance from the vent of each ballistic (n x 1 vector) |
| r | Angle from the vent of each ballistic (n x 1 vector) |
| xi | X coordinate of each ballistic on the cartesian grid (n x 1 vector) |
| yi | Y coordinate of each ballistic on the cartesian grid (n x 1 vector) |
| data | Original data contained in the user-defined input file |
.pixel
| Field | Description |
|---|---|
| east | Easting coordinates of the cartesian grid (i x j matrix, where i and j represent the northing and easting intervals of a grid of resolution gridRes covering the entire ballistic field, respectively) |
| north | Northing coordinates of the cartesian grid (i x j matrix) |
| lat | Latitude of the cartesian grid (i x j matrix) |
| lon | Longitude of the cartesian grid (i x j matrix) |
| Nt | Number of ballistics in each pixel of the cartesian grid (i x j matrix) |
| E | Kinetic energy (J) at impact for a given exceedance probability computed on the cartesian grid (i x j x pT matrix) |
| N | Number of ballistics with kinetic energies exceeding a given energy threshold in each pixel of the cartesian grid (i x j x eT matrix) |
| Pabs | Absolute probability (%) for ballistic impacts to exceed an energy threshold (i x j x eT matrix) |
| Prel | Relative probability (%) for ballistic impacts to exceed an energy threshold |
.concentric
| Field | Description |
|---|---|
| bin | Distances of the concentric rings around the vent (m) |
| Nt | Number of ballistics in each concentric ring (length(bin) x 1 vector) |
| N | Number of ballistics with kinetic energies exceeding a given energy threshold in each concentric ring (length(bin) x eT matrix) |
| E | Kinetic energy (J) at impact for a given exceedance probability computed in each concentric ring (length(bin) x pT matrix) |
| Pabs | Absolute probability (%) for ballistic impacts to exceed an energy threshold (length(bin) x eT matrix) |
| Prel | Relative probability (%) for ballistic impacts to exceed an energy threshold (length(bin) x eT matrix) |
| east | Easting coordinates of the cartesian grid used to represent the concentric rings on a map (i x j matrix). i and j represent the northing and easting intervals of a grid of resolution gridRes(2) (or 10% of gridRes(1) covering the entire ballistic field, respectively |
| north | Northing coordinates of the cartesian grid used to represent the concentric rings on a map (i x j matrix) |
| lat | Latitude of the cartesian grid used to represent the concentric rings on a map (i x j matrix) |
| lon | Longitude of the cartesian grid used to represent the concentric rings on a map (i x j matrix) |
Note that binM, NtM, NM, EM, PabsM and PrelM contain the same data as bin, Nt, N, E, Pabs and Prel gridded on a matrix, which can be used along east/north or lon/lat for plotting on a map.
.radial
| Field | Description |
|---|---|
| bin | Distances of the radial sectors around the vent (m) |
| Nt | Number of ballistics in each radial sector (length(bin) x 1 vector) |
| N | Number of ballistics with kinetic energies exceeding a given energy threshold in each radial sector (length(bin) x eT matrix) |
| E | Kinetic energy (J) at impact for a given exceedance probability computed in each radial sector (length(bin) x pT matrix) |
| Pabs | Absolute probability (%) for ballistic impacts to exceed an energy threshold (length(bin) x eT matrix) |
| Prel | Relative probability (%) for ballistic impacts to exceed an energy threshold (length(bin) x eT matrix) |
| east | Easting coordinates of the cartesian grid used to represent the radial sectors on a map (i x j matrix). i and j represent the northing and easting intervals of a grid of resolution gridRes(2) (or 10% of gridRes(1) covering the entire ballistic field, respectively |
| north | Northing coordinates of the cartesian grid used to represent the radial sectors on a map (i x j matrix) |
| lat | Latitude of the cartesian grid used to represent the radial sectors on a map (i x j matrix) |
| lon | Longitude of the cartesian grid used to represent the radial sectors on a map (i x j matrix) |
Here again, binM, NtM, NM, EM, PabsM and PrelM contain the same data as bin, Nt, N, E, Pabs and Prel gridded on a matrix, which can be used along east/north or lon/lat for plotting on a map.
4 Displaying results
The displayGBF function offers an interactive GUI to plot the results of the processGBF function. Start it by typing
displayGBFin the Matlab command. Then select the